The SIN tests
Here we use MUTIS to analyze the correlations between simple functions, as a method for veryfing the correct functioning of MUTIS.
[1]:
# I'm doing a lot of changes to MUTIS while writting this, better reload automatically.
%load_ext autoreload
%autoreload 2
[2]:
import numpy as np
import scipy as sp

import matplotlib as mplt
import matplotlib.pyplot as plt

from mutis.signal import Signal
from mutis.correlation import Correlation

from numpy import pi as pi

def vertlines(x0,a,b,s):
    for x in (x0+s*np.arange(a,b)):
        ax.axvline(x=x, ymin=-1,ymax=+1, color='m', linewidth=3, alpha=0.5)
1. Sinusoidal functions
[3]:
# Build signal 1
t1_o = np.linspace(2,6,40)
s1_o = np.sin(t1_o)

msk1 = np.random.randn(t1_o.size) > 0.6

t1_s = t1_o[msk1]
s1_s = s1_o[msk1]
[4]:
# Build signal 2
t2_o = np.linspace(8,12,40)
s2_o = np.sin(t2_o)

msk2 = np.random.randn(t2_o.size) > 0.6

t2_s = t2_o[msk2]
s2_s = s2_o[msk2]
[5]:
plt.figure()
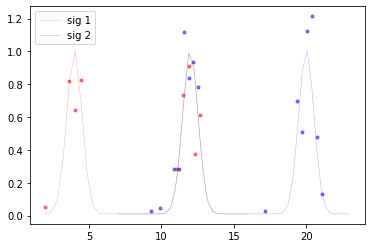
plt.plot(t1_o,s1_o,'r-', lw=0.5, alpha=0.5, label='sig 1')
plt.plot(t1_s,s1_s,'r.', alpha=0.5)
plt.plot(t2_o,s2_o,'b-', lw=0.5, alpha=0.5, label='sig 2')
plt.plot(t2_s,s2_s,'b.', alpha=0.5)
plt.legend()
plt.show()

From this singals we would expect a maximum at 11-5=6, and several max and mins at distances of pi from this.
[6]:
sig1_o = Signal(t1_o, s1_o, fgen='lc_gen_psd_nft')
sig2_o = Signal(t2_o, s2_o, fgen='lc_gen_psd_nft')
corr_o = Correlation(sig1_o,sig2_o,'welsh')
[7]:
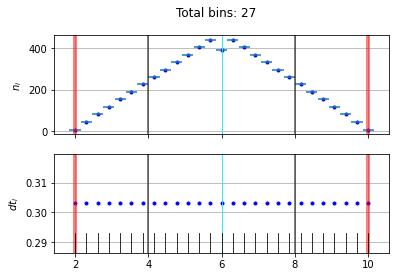
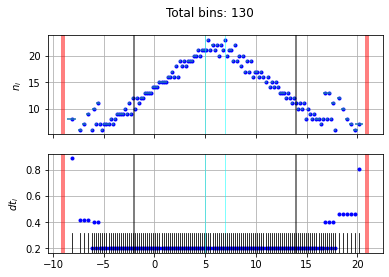
corr_o.gen_times(dtmin=0.1, dtmax=3, nbinsmin=3)
corr_o.plot_times(rug=True)

[8]:
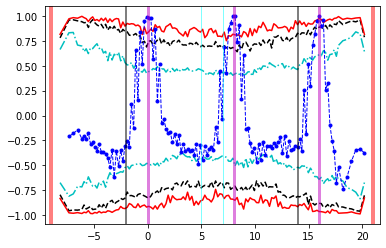
corr_o.gen_synth(400)
corr_o.gen_corr()
fig, ax = plt.subplots()
corr_o.plot_corr()
vertlines(6,-1,2, pi)
uncert is True but no uncertainties for Signal 1 were specified, setting uncert to False
uncert is True but no uncertainties for Signal 1 were specified, setting uncert to False
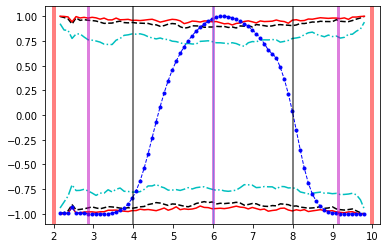
Indeed the correlation with the origina signals shows the expected peaks in their positions (the vertical red lines)
[9]:
sig1_s = Signal(t1_s, s1_s, fgen='lc_gen_psd_nft')
sig2_s = Signal(t2_s, s2_s, fgen='lc_gen_psd_nft')
corr_s = Correlation(sig1_s,sig2_s,'welsh')
[10]:
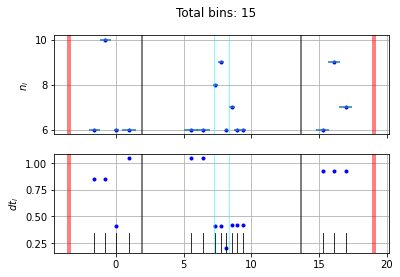
corr_s.gen_times(dtmin=0.3, dtmax=4, nbinsmin=5)
corr_s.plot_times(rug=True)

[11]:
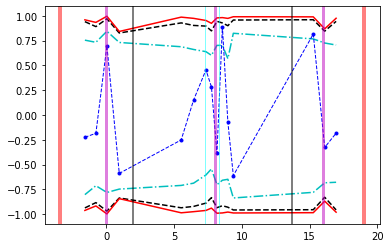
corr_s.gen_synth(400)
corr_s.gen_corr()
fig, ax = plt.subplots()
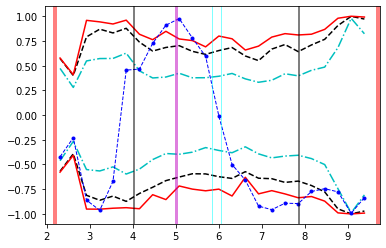
corr_s.plot_corr()
vertlines(6,-1,2,pi)
uncert is True but no uncertainties for Signal 1 were specified, setting uncert to False
uncert is True but no uncertainties for Signal 1 were specified, setting uncert to False

However, the correlation with the sampled signals shows only the central maximum and one of the minima, both with some uncertainy.
2. Pulse functions
[12]:
# Build signal 1
t1_o = np.linspace(2,6,80)
s1_o = np.exp(-0.8*(t1_o-4)**2)

msk1 = np.random.randn(t1_o.size) > 0.6

t1_s = t1_o[msk1]
s1_s = s1_o[msk1]
[13]:
# Build signal 2
t2_o = np.linspace(8,12,80)
s2_o = np.exp(-0.8*(t2_o-9)**2)

msk2 = np.random.randn(t2_o.size) > 0.5

t2_s = t2_o[msk2]
s2_s = s2_o[msk2]
[14]:
plt.figure()
plt.plot(t1_o,s1_o,'r-', lw=0.5, alpha=0.3, label='sig 1')
plt.plot(t1_s,s1_s,'r.', alpha=0.5)
plt.plot(t2_o,s2_o,'b-', lw=0.5, alpha=0.3, label='sig 2')
plt.plot(t2_s,s2_s,'b.', alpha=0.5)
plt.legend()
plt.show()

From these signals we would expect a strong maximum at 5 with close minima.
[15]:
sig1_o = Signal(t1_o, s1_o, fgen='lc_gen_psd_nft')
sig2_o = Signal(t2_o, s2_o, fgen='lc_gen_psd_nft')
corr_o = Correlation(sig1_o,sig2_o,'welsh')
[16]:
corr_o.gen_times(dtmin=0.3, dtmax=2, nbinsmin=5)
corr_o.plot_times(rug=True)
[17]:
corr_o.gen_synth(400)
corr_o.gen_corr()

fig, ax = plt.subplots()
corr_o.plot_corr()
vertlines(5,0,1,0)
uncert is True but no uncertainties for Signal 1 were specified, setting uncert to False
uncert is True but no uncertainties for Signal 1 were specified, setting uncert to False

Which is what was expected.
[18]:
sig1_s = Signal(t1_s, s1_s, fgen='lc_gen_psd_nft')
sig2_s = Signal(t2_s, s2_s, fgen='lc_gen_psd_nft')
corr_s = Correlation(sig1_s,sig2_s,'welsh')
[19]:
corr_s.gen_times(dtmin=0.3, dtmax=2, nbinsmin=3)
corr_s.plot_times(rug=True)

[20]:
corr_s.gen_synth(400)
corr_s.gen_corr()
fig, ax = plt.subplots()
corr_s.plot_corr()
vertlines(5,0,1,0)
uncert is True but no uncertainties for Signal 1 were specified, setting uncert to False
/home/docs/checkouts/readthedocs.org/user_builds/mutis/envs/latest/lib/python3.7/site-packages/numba/np/ufunc/gufunc.py:146: RuntimeWarning: invalid value encountered in _welsh_numba
  return self.ufunc(*args, **kwargs)
/home/docs/checkouts/readthedocs.org/user_builds/mutis/envs/latest/lib/python3.7/site-packages/numba/np/ufunc/gufunc.py:146: RuntimeWarning: divide by zero encountered in _welsh_numba
  return self.ufunc(*args, **kwargs)
/home/docs/checkouts/readthedocs.org/user_builds/mutis/envs/latest/lib/python3.7/site-packages/numpy/lib/function_base.py:3961: RuntimeWarning: invalid value encountered in subtract
  diff_b_a = subtract(b, a)
uncert is True but no uncertainties for Signal 1 were specified, setting uncert to False
Which is as expected, but uglier.
3. Several pulses, with error
[21]:
# Build signal 1
t1_o = np.linspace(2,16,35)
s1_o = np.exp(-1.8*(t1_o-4)**2) + np.exp(-1.8*(t1_o-12)**2) + 0.01

msk1 = np.random.rand(t1_o.size) < 1.5*(s1_o+0.1)

t1_s = t1_o[msk1]
s1_s = s1_o[msk1]

# ... and add error:
t1_s = t1_s + 0.01*np.random.randn(t1_s.size)
s1_s = s1_s + 0.3*s1_s*np.random.randn(s1_s.size)  + 0.05*np.random.rand(s1_s.size)
[22]:
# Build signal 2
t2_o = np.linspace(7,23,50)
s2_o = np.exp(-1.8*(t2_o-12)**2) + np.exp(-1.8*(t2_o-20)**2) + 0.01

msk2 = np.random.rand(t2_o.size) < 1.5*(s2_o+0.1)

t2_s = t2_o[msk2]
s2_s = s2_o[msk2]

# ... and add error:
t2_s = t2_s + 0.01*np.random.randn(t2_s.size)
s2_s = s2_s + 0.3*s2_s*np.random.randn(s2_s.size) + 0.05*np.random.rand(s2_s.size)
[23]:
plt.figure()
plt.plot(t1_o,s1_o,'r-', lw=0.5, alpha=0.3, label='sig 1')
plt.plot(t1_s,s1_s,'r.', alpha=0.5)
plt.plot(t2_o,s2_o,'b-', lw=0.5, alpha=0.3, label='sig 2')
plt.plot(t2_s,s2_s,'b.', alpha=0.5)
plt.legend()
plt.show()
From these signals we would expect a strong maximum at 8 with close minima (and maybe others peaks near 16 and 0)
[24]:
sig1_o = Signal(t1_o, s1_o, fgen='lc_gen_psd_nft')
sig2_o = Signal(t2_o, s2_o, fgen='lc_gen_psd_nft')
corr_o = Correlation(sig1_o,sig2_o,'welsh')
[25]:
corr_o.gen_times(dtmin=0.2, dtmax=1, nbinsmin=6)
corr_o.plot_times(rug=True)
[26]:
corr_o.gen_synth(400)
corr_o.gen_corr()

fig, ax = plt.subplots()
corr_o.plot_corr()
vertlines(8,0,1,0)
vertlines(16,0,1,0)
vertlines(0,0,1,0)
uncert is True but no uncertainties for Signal 1 were specified, setting uncert to False
/home/docs/checkouts/readthedocs.org/user_builds/mutis/envs/latest/lib/python3.7/site-packages/numba/np/ufunc/gufunc.py:146: RuntimeWarning: divide by zero encountered in _welsh_numba
  return self.ufunc(*args, **kwargs)
uncert is True but no uncertainties for Signal 1 were specified, setting uncert to False
Which is what was expected.
[27]:
sig1_s = Signal(t1_s, s1_s, fgen='lc_gen_psd_nft')
sig2_s = Signal(t2_s, s2_s, fgen='lc_gen_psd_nft')
corr_s = Correlation(sig1_s,sig2_s,'welsh')
[28]:
corr_s.gen_times(dtmin=0.2, dtmax=3, nbinsmin=6)
corr_s.plot_times(rug=True)
[29]:
corr_s.gen_synth(400)
corr_s.gen_corr()
fig, ax = plt.subplots()
corr_s.plot_corr()
vertlines(8,0,1,0)
vertlines(16,0,1,0)
vertlines(0,0,1,0)
uncert is True but no uncertainties for Signal 1 were specified, setting uncert to False
uncert is True but no uncertainties for Signal 1 were specified, setting uncert to False
Which is as expected, but uglier.
[ ]: